Operations and Institutional Arrangement
SDG 5: Focus Areas
5.6.7 Track Women’s Graduation Rate
Does your university as a body have measurement/tracking of women’s likelihood of graduating compared to men’s, and schemes in place to close any gap?
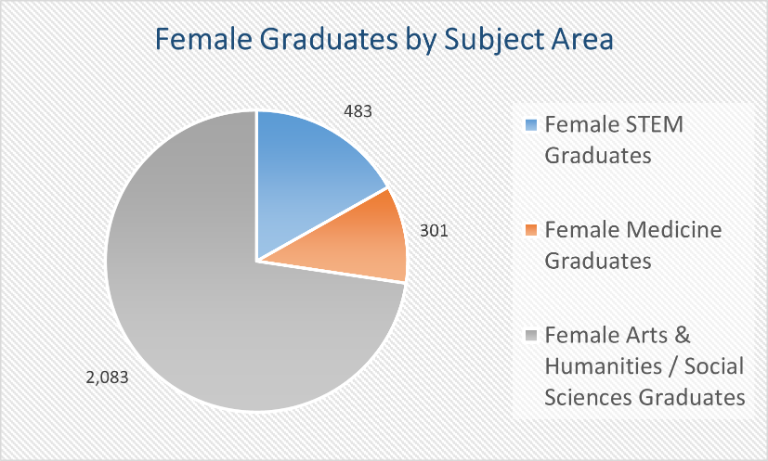
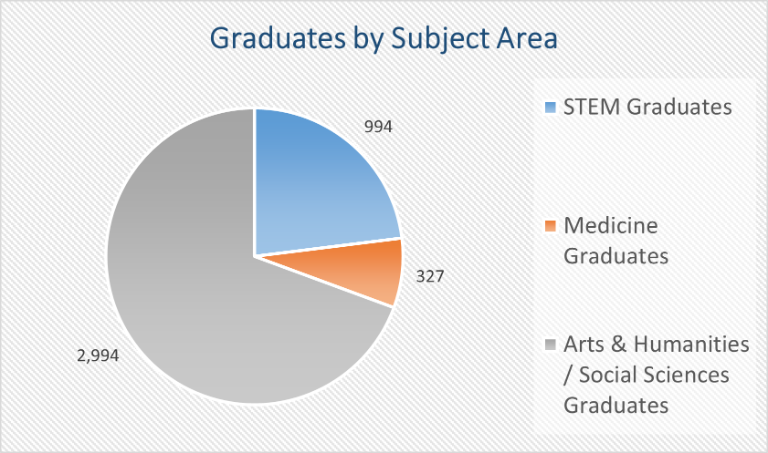
The University systematically records and reports graduate data disaggregated by gender and degree level across multiple academic years. The dataset below indicates that female graduates consistently represent the most completers, accounting for approximately 68-69% of all graduates between the academic years 2022/2023 and 2024/2025. At the undergraduate level, female representation ranges from 68% to 69%, while in master’s programs it ranges from 60% to 66%. Doctoral-level outcomes demonstrate near gender parity, with female graduates representing between 48% and 54% over the same period.
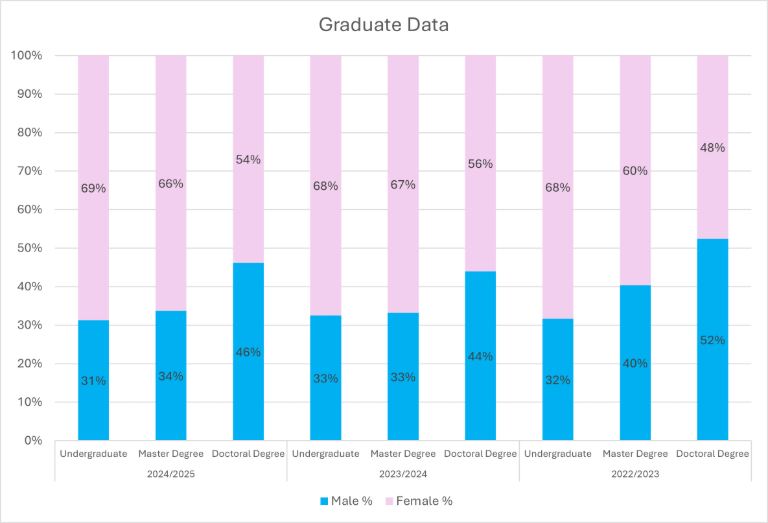
Graduate Follow-Up and Tracking Results (2023–2024):
- Total Graduates: 5754
- Total Female Graduates: 3845 (66.82%)
Note: The following are not included in the table:
- Diploma / Associate Diploma Students
- Postgraduate Diploma Students
Tracking Women’s Employment
- UOB tracks employment outcomes for graduates by gender, including employment sector, time to employment, salary, and further study.
Gender Distribution and Total Enrollment by Academic Year and Study Level
The dataset above across all years, shows:
- Female enrollment is consistently higher than male enrollment (60% and above) from the first year onwards and continues throughout the student journey.
- Female retention and progression rates remain stable, with the number of female students in later years staying substantially higher than male students in the same cohorts.
- The continuation and persistence of female students through advanced years contribute to a higher projected graduation likelihood for women compared to men within the same cohorts.
In addition to tracking progression and graduation likelihood by gender, UOB implements several measures to ensure equitable outcomes and address any potential gender gaps. These include systematic monitoring of gender, disaggregated retention data, targeted academic advising for students at risk, equal-opportunity admission policies, and support programs designed to empower female students across academic disciplines. These initiatives help maintain balanced graduation rates and ensure that both women and men receive equitable support throughout their academic journey.
Continuous Improvement
The University of Bahrain is currently developing an initiative to enhance its data-driven quality assurance by updating the cohort analysis reports generated from the Student Information System.
The proposed enhancement will retain the existing indicators on retention, transferred students, dropouts, and graduates, while introducing additional gender-disaggregated metrics, in particular, the likelihood of male and female students to progress and graduate.
Subject to approval, this customized cohort analysis will be embedded as standard evidence set within the Annual Self-Evaluation Report that every program prepares under the Annual and Periodic Academic Programs Review Policy, which mandates yearly program review based on systematically collected data.
Integrating these gender-sensitive indicators into the annual monitoring cycle is expected to enable the early identification and tracking of any emerging gender gaps in enrolment, progression, and completion, and to support timely, targeted academic and pastoral interventions at the program and college level. Once implemented, this initiative will strengthen the University’s contribution to the Sustainable Development Goals, particularly SDG 4 (Quality Education), SDG 5 (Gender Equality), and SDG 10 (Reduced Inequalities), by mainstreaming inclusive, evidence-based decision-making across its academic program.
Schemes to Close Gender Gaps
- UOB implements regulated academic advising , career counselling, and employability mentoring programs, all designed to support student progression and close any observed gender gaps.
- The university’s family-support policies, including parental leave and flexible arrangements, further enable women, especially recent mothers, to continue and complete their studies.
Transparency
- Graduation and employment data are published in annual reports, UoB open Data, Bahrain Open Data Portal and sustainability dashboards, ensuring transparency and accountability.
- Disaggregated data by cohort, program, and field of study inform targeted interventions and continuous improvement.
The University of Bahrain’s robust tracking systems and support schemes have resulted in female students achieving higher graduation rates and strong employment outcomes. These efforts reflect UOB’s commitment to advancing gender equity and fulfilling the requirements of THE Impact Ranking indicator 5.6.7, positioning the university for full points in this category.

